


With a dome-shaped crown and twisting trunk, one could imagine southern catalpa coming out of a fantasy book! (Photo by Adobe Stock)
Extension for Real Life Blog
")
")
")
Pages

Select Your County Office
Watch


Extension Matters Magazine
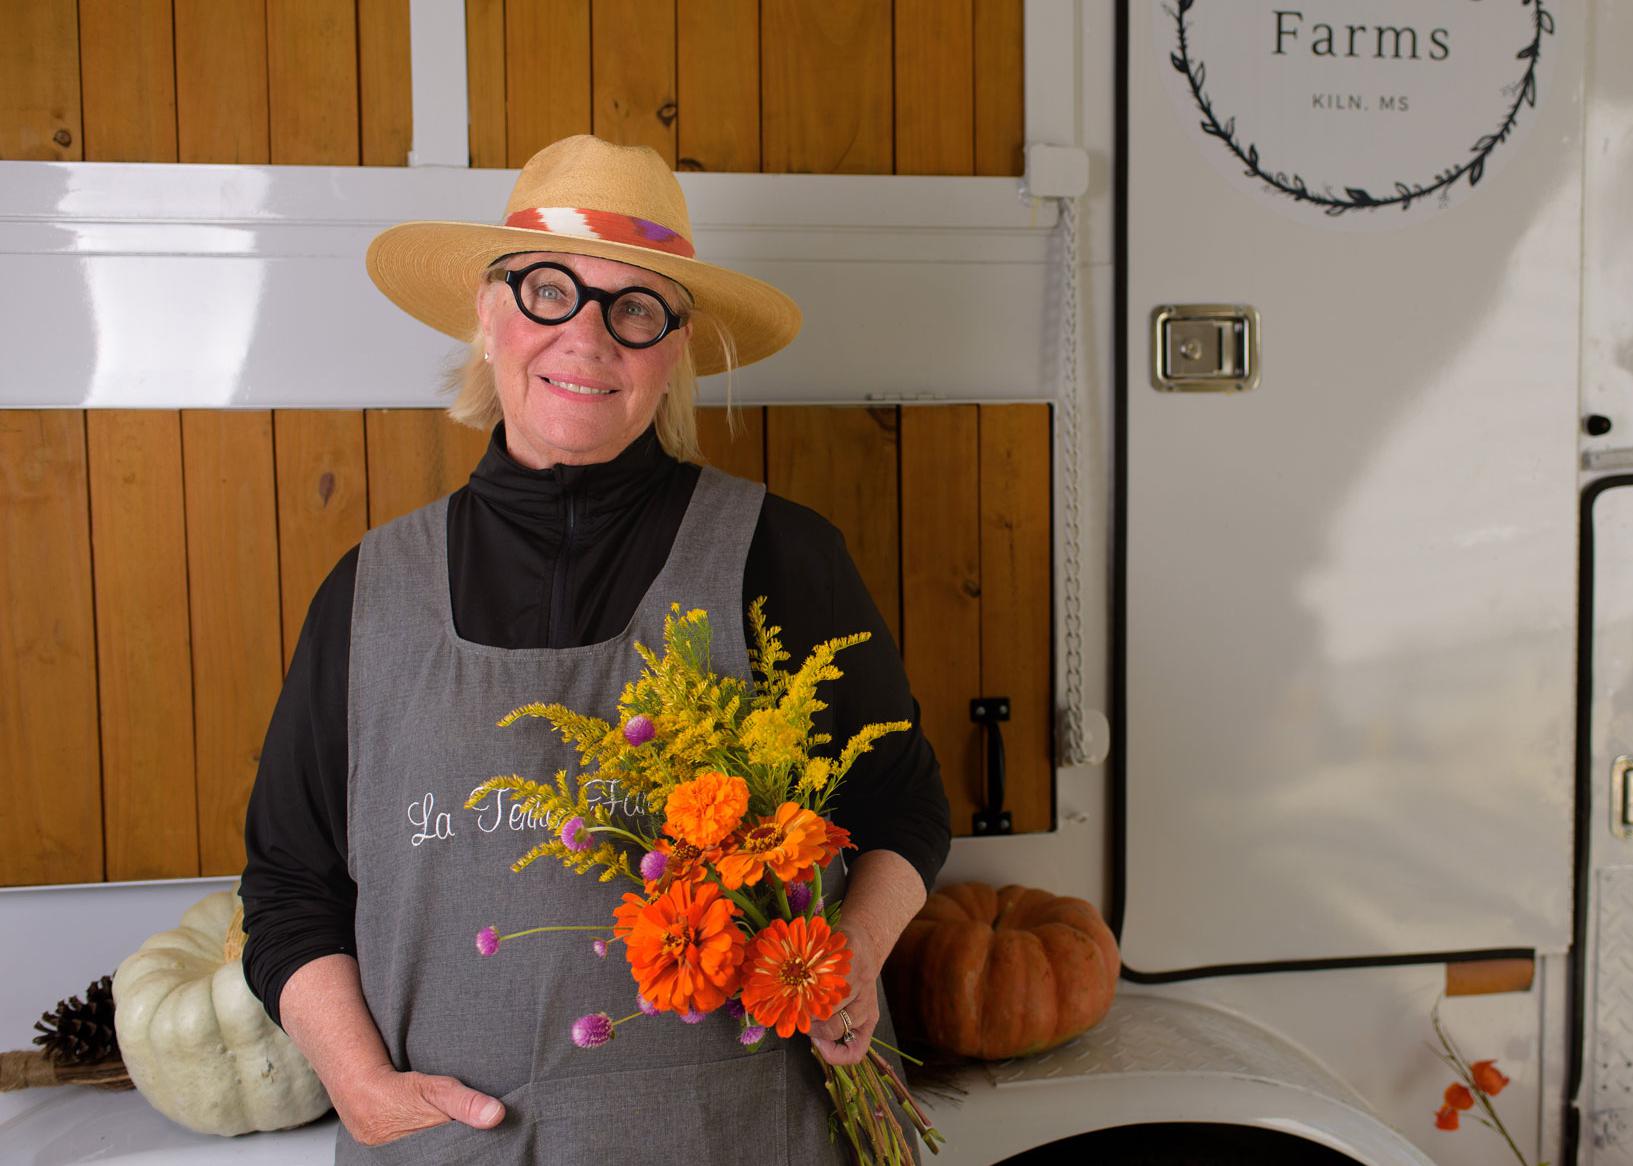
Teri Wyly, co-owner of La Terre Farms in Hancock County
Upcoming Events
Recent Publications
Publication Number: P3395
Publication Number: P3195
Publication Number: P3591
Publication Number: P3189
Publication Number: P2421