


")

")
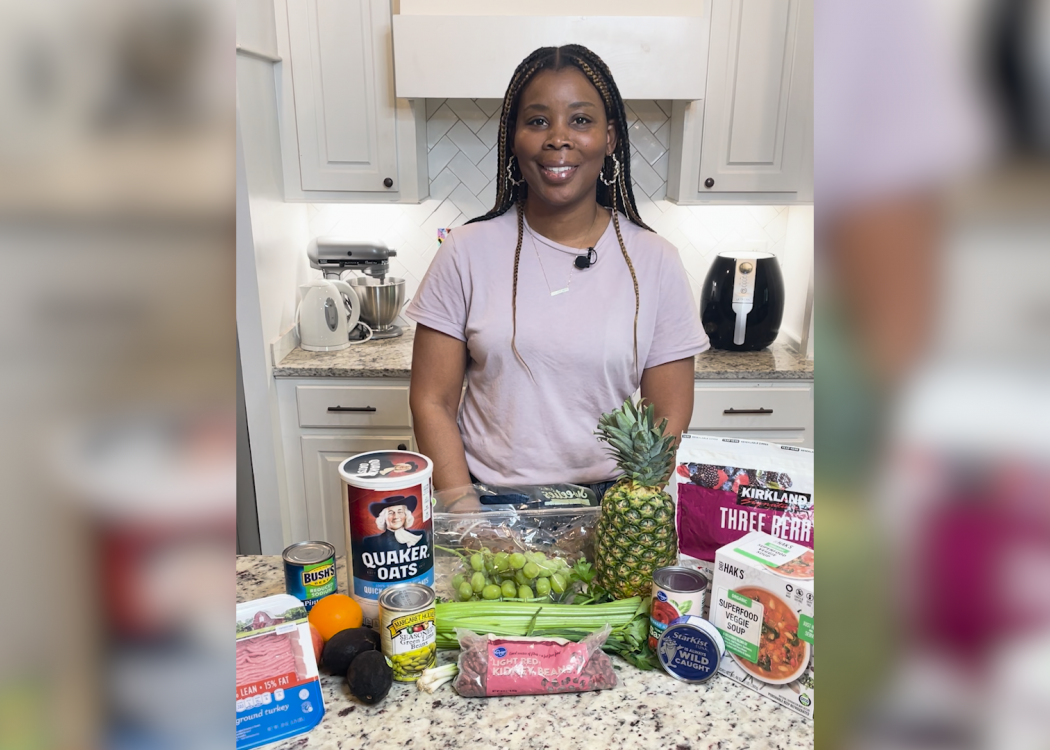
Beginning and maintaining a healthy diet does not have to be complicated. Following these simple tips can help.
Extension for Real Life Blog
Pages
Select Your County Office
Watch

Extension Matters Magazine
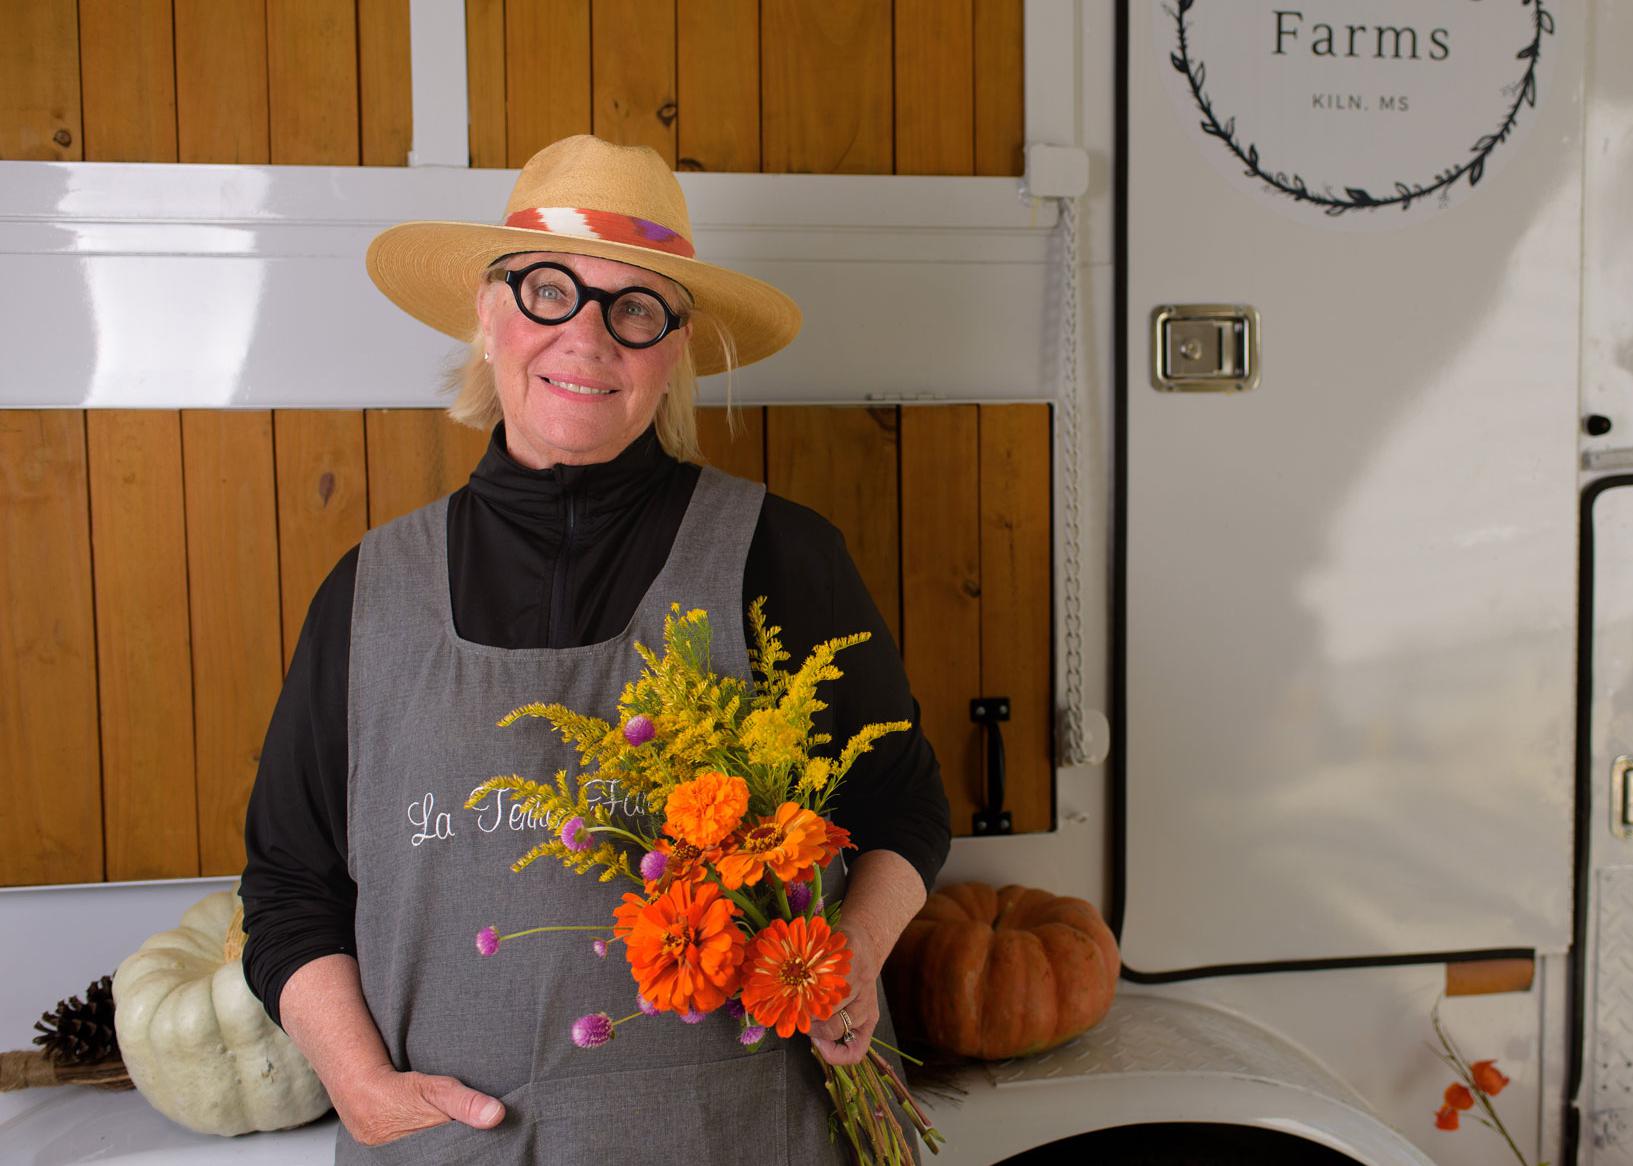
Teri Wyly, co-owner of La Terre Farms in Hancock County
Upcoming Events
Recent Publications
Publication Number: P2690
Publication Number: P1446
Publication Number: P3322
Publication Number: P3195
Publication Number: 3992