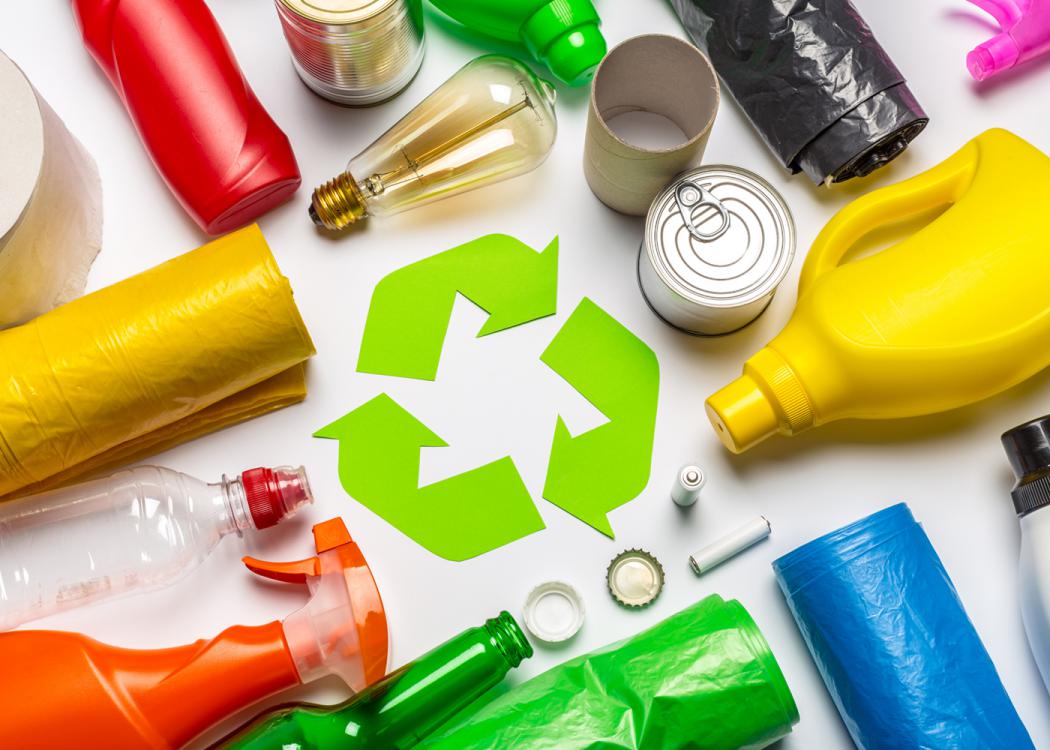
|
Vol.
22, No. 18 Economics of Turfgrass Establishment
Steven W. Martin and Wayne Wells
IntroductionMany U.S. farmers are experiencing financial difficulty (Ratliff). The current farm financial crisis is the result of low commodity prices combined with below-average yields. While government disaster payments and increased subsidies have helped, owner equity has still declined. This is in contrast with the rest of the U.S. economy; during the last decade, the gross domestic product (GDP) has increased by 23 percent and the Dow-Jones Industrial Average, by 291 percent (U.S. Department of Commerce). This contrast has caused many farmers to look for alternative crops and alternative means of income (Adrian et al.). The growth in the U.S. economy has led to increased housing starts, new office development, golf course development and recreational complex development. This economic growth has also led to an increased demand for turfgrass (McCarty et al.). In 1995, U.S. homeowners spent more than $535 million on lawn sod (Adrian et al.). Many areas in Mississippi also have seen an increased demand for turfgrass. Subsequently, many Mississippi farmers are considering turfgrass as an alternative crop.
ObjectivesThe objective of this study is to evaluate the economic feasibility of turfgrass production. In a similar and more elaborate study in 1995, Adrian et al. analyzed the economic feasibility of turfgrass in conjunction with different row crop mixtures. However, the 1996 Federal Agriculture Improvement and Reform Act (FAIR) makes the current farm situation somewhat different from the farm situation described in their research. More importantly, turfgrass production is location specific. Sod markets differ depending on their proximity to areas experiencing economic growth, and turfgrass varieties differ depending on the degree of latitude (McCarty et al., Adrian et al., Hall et al.). Therefore location-specific budgets need to be developed for turfgrass varieties. Additionally, sensitivity analyses on sod price, market saturation, and variety selection are needed. The objective of the study was accomplished through the development of enterprise budgets for hybrid Bermuda turfgrass and Zoysia turfgrass for the northern half of Mississippi. Particular attention was given to trips-over-the-field. The initial budgets were developed for a 40-acre sod farm. Selected capital investments needed for a 40-acre sod farm are also reported. Based on the enterprise budgets developed, returns above specified costs for various sod prices are analyzed. Finally, the issues of market saturation and variety selection are addressed.
Data and MethodsSelected producers in North MS were contacted in order to obtain actual on-farm information on turfgrass establishment. To prepare establishment budgets, these on-farm practices were summarized and adjusted for agronomic concerns. The budgets were produced using the Mississippi State Budget Generator (MSBG); this tool is available on the web at http://www.agecon.msstate.edu/researchandinformation/software.asp. The MSBG contains the 2000 Mississippi State University Planning Budgets (MSUPB). Where appropriate, input prices and performance rates contained in the MSUPB were used. For those inputs and performance rates unique to the turfgrass industry and not contained in the MSUPB, actual data from producers and manufacturers were summarized and used. Table 1 shows an establishment budget for hybrid Bermuda turfgrass; table 2 shows an establishment budget for Zoysia turfgrass. These budgets do not include delivery, installation, returns to management, land costs or the initial cost of a well. Table 3 shows summarized prices for selected capital investments needed for turfgrass production. Tables 4 and 5 show returns above specified costs for selected prices for hybrid Bermuda and Zoysia grass, respectively. Table 6 shows average on farm prices for hybrid Bermuda and Zoysia for the 1998-2000 growing seasons. As can
be seen in tables
1
and 2,
hybrid Bermuda is $1,166 per acre less expensive to
establish than Zoysia. Hybrid Bermuda grows much faster and
can be harvested sooner. Hybrid Bermuda is typically
harvested 12-16 weeks after sprigging; Zoysia grass is
usually not harvested until approximately 15-20 months after
sprigging. This increases costs due to the additional
waterings and mowings, and interest on the investment.
Additionally, fertilizer and chemical costs for the fall and
preceding spring are included in the establishment budget
for Zoysia, whereas they would be included in a maintenance
budget for hybrid Bermuda. The major differences in
establishment costs are the additional waterings and mowings
needed over an additional 8-12 months, and the lack of cash
flow associated with the delayed harvest of the Zoysia
variety. The delayed cash flow was mentioned by many
producers as the reason for planting hybrid Bermuda instead
of Zoysia. It
should be mentioned that initial land preparation can vary
significantly regardless of grass variety. Most producers
preferred land that had been row-cropped for the last
several years. Such land is relatively free of weeds and
grasses. Land that is not weed/grass free or has some type
of grass already established (such as pasture, hay, etc.)
will likely require fumigation in order to eliminate present
vegetation and seeds. If fumigation costs are included,
establishment costs will increase by $1000-1700/acre above
costs specified in tables
1
and 2.
Because of the magnitude of this added expense, most
producers select land that has previously been in a row crop
operation. Table
6
shows on-farm sod prices for the 1998-2000 growing seasons.
The 2000 growing season was extremely dry and hot. Those
producers without irrigation were severely affected. Those
with irrigation had to work extremely hard to keep grass
growing vigorously. The hot, dry weather caused a decrease
in production per acre. However, the decrease in production
per acre was offset somewhat by new producers entering the
market. This, coupled with rising interests rates (and
consequently, lower housing starts), made turfgrass readily
available; ready availability brought reports of lower grass
prices. At
current prices, both Zoysia and hybrid Bermuda show positive
returns above specified costs. Only weed pest management has
been considered in the establishment budgets. Insect and
disease control are often not needed but (when necessary)
can result in considerable additional expense. Potential
growers also need to consider local costs associated with
obtaining an adequate well for irrigation (quotes ranged
from $10,000 - $80,000). Additionally, the opportunity costs
associated with land and management must be considered.
The
lower grass prices and the increased number of producers
growing hybrid Bermuda could be an indication of market
saturation for hybrid Bermuda. While most established
producers sold all their 2000 crop, some first year
producers were able to market only 20 percent of their crop.
The degree of substitution between Zoysia and hybrid Bermuda
is then a factor to consider. If the market price for hybrid
Bermuda falls, it might be assumed that the price of Zoysia
will also fall. However, Zoysia has some unique
characteristics that may keep it at a premium when compared
to hybrid Bermuda. The degree of substitution is unknown at
this time. However, the implication may be that producers
should consider Zoysia or other grasses as a long-term
investment. Even though the establishment costs are higher,
if Zoysia is able to maintain or increase its current price
while hybrid Bermuda prices fall, Zoysia might be the better
investment.
Most
turfgrass is sold delivered to the buyer. Some is sold
delivered and installed. Thus, there is an immediate need
for research on the costs associated with the delivery
and/or installing of turfgrass. Additionally, the degree of
substitution between varieties and the price fluctuations
for each variety need to be researched in order to further
understand the market dynamics associated with turfgrass
production. ITEM
DIRECT
EXPENSES Custom Custom
chisel plow 7.50 7.50 Custom
spread (truck) 3.50 3.50 Sod
sprig 1200.00 1200.00 Fertilizer Lime
(spread) 26.73 26.73 Amm
nitrate (34%N) 9.15 41.17 Phosphate
(46% P2O5) 12.47 18.70 Potash
(60% K2O) 8.35 8.35 Herbicide Roundup
Ultra 5.68 34.08 Atrazine
4L 1.34 5.36 2,4-D
Amine 1.52 2.28 MSMA
+ surfactant 1.97 11.82 Other Wood
pallets 6.00 228.00 Operator
labor Tractors 8.31 93.58 Hand
labor Implements 6.91 112.67 Unallocated
labor 8.31 93.58 Diesel
fuel Tractors 1.20 34.73 Self-propelled
equipment 1.20 27.00 Repair
& maintenance Implements 74.27 74.27 Tractors 21.82 21.82 Self-propelled
equipment 9.66 9.66 Interest
on operating capital 50.67 50.67 FIXED
EXPENSES Implements 188.89 188.89 Tractors 53.25 53.25 Self-propelled
equipment 43.33 43.33 285.47 *Note:
Cost of production estimates are based on 1999
input prices. DIRECT
EXPENSES Custom Custom
chisel plow acre 7.50 1.0000 7.50 Custom
spread (truck) appl 3.50 2.0000 7.00 Sod
sprig acre 1800.00 1.0000 1800.00 Fertilizer Lime
(spread) ton 26.73 2.0000 53.46 Amm
nitrate (34%N) cwt 9.15 7.0000 64.05 Phosphate
(46% P2O5) cwt 12.47 1.5000 18.70 Potash
(60% K2O) cwt 8.35 1.0000 8.35 0-20-20 cwt 10.90 3.0000 32.70 Herbicide Roundup
Ultra pt 5.68 6.0000 34.08 Atrazine
4L pt 1.34 4.0000 5.36 2,4-D
Amine pt 1.52 4.5000 6.84 MSMA
+ surfactant pt 1.97 18.0000 35.46 Other Wood
pallets each 6.00 38.0000 228.00 Operator
labor Tractors hour 8.31 13.7600 114.34 Hand
labor Implements hour 6.91 16.4950 113.98 Unallocated
labor hour 8.31 13.7600 114.34 Diesel
fuel Tractors gal 1.20 31.3760 37.65 Self-propelled
equipment gal 1.20 58.5000 70.20 Repair
and maintenance Implements acre 84.70 1.0000 84.70 Tractors acre 26.66 1.0000 26.66 Self-propelled
equipment acre 25.13 1.0000 25.13 Interest
on operating capital acre 261.47 1.0000 TOTAL
DIRECT EXPENSES FIXED
EXPENSES Implements acre 209.28 1.0000 209.28 Tractors acre 65.09 1.0000 65.09 Self-propelled
equipment acre 112.66 1.0000 112.66 TOTAL
FIXED EXPENSES 387.03 TOTAL
SPECIFIED EXPENSES *Note:
Cost of production estimates are based on 1999
input prices. Land
54@$857/acre $46,278 Buildings 2500@$20/sq
ft $50,000 Well/pump/risers $40,000 Tractors 45hp $20,000 50
hp $21,700 70hp $30,000 Spin
spreader 4
ton $7,140 Boom
sprayer 21
ft $1,453 42
ft $4,010 Rotary
mower 6
ft $1,523 12
ft $6,940 15
ft $9,693 Irrigation Traveling
gun $22,000 Harvesters Small
block $50,000 Large
roll $40,000 Other Roller/12ft $3,050 Forklift $21,000 Trailer
20ft. $1,810 Sweep/vac $11,700 Blower
3pt $3,500 Trucks Pickup $15,000 Bob/2-ton $31,000 Sod
prices Revenue
@ 3800 yd per acre Minus
specified costs Returns
above specified costs Sod
Prices Revenue
@ 3800 yd per acre Minus
specified costs Returns
above specified costs Turf Hybrid
Bermuda Zoysia ReferencesAdrian, John L., William M. Loyd, and Patricia A. Duffy. Economic Feasibility of Turfgrass-Sod Production. Alabama Agricultural Experiment Station. Auburn University. Bulletin 625. March 1995. Hall, Charles R., Lennie G. Kizer, Jeffery V. Krans, Travis D. Phillips and G. Euel Coats. Economic and Agronomic Analysis of Mississippi Turfgrass Sod Farms. Agricultural Economics Research Report 182. Mississippi State University. September 1988. Laughlin, David H. and Stan R. Spurlock. Mississippi State Budget Generator. Agricultural Economics Department. Mississippi State University. Mississippi State, Mississippi. Mississippi State Budget Generator Users Guide, Version 5.2 for Windows. Agricultural Economics Department. Mississippi State University. Mississippi State, Mississippi. McCarty, Bert, Gil Landry, Jr., Jeff Higgins, and Landon Miller. Sod Production in the Southern United States. Extension Circular 702, Clemson University Cooperative Extension Service. Clemson, South Carolina. Ratliff, Tonya. Ag Leaders Tell Congress to Fix 1996 Farm Bill. Available at http://www.agweb.com/news/news.cfm?id=8818&breakingnews=1&pf=1. July 2000. Thompson, J. H. Mississippi Turfgrass Association Newsletter. Volume 33, Number 9, September 2000. U. S. Department of Commerce, Bureau of Economic Analysis. Gross Domestic Product: Implicit Price Deflator 1992=100, Seasonally Adjusted. Available at http://www.stls.frb.org/fred/data/gdp/gdpdef. The Federal Reserve Bank of St. Louis. 1999.
Martin is an assistant specialist at the Delta Research and Extension Center (DREC) in Stoneville; Wells is an assistant specialist in the Department of Plant and Soil Sciences, Mississippi State University. For more information, contact Martin at 662-686-3264; e-mail SMartin@ext.msstate.edu. This research report was published by the Office of Agricultural Communications, a unit of the Division of Agriculture, Forestry, and Veterinary Medicine at Mississippi State University.
Mention of a trademark or proprietary product does not constitute a guarantee or warranty of the product by the Mississippi Agricultural and Forestry Experiment Station and does not imply its approval to the exclusion of other products that also may be suitable. 16716/350
|
||||||||||||||||||||||||||||||||||||||||||||||||||||||||||||||||||||||||||||||||||||||||||||||||||||||||||||||||||||||||||||||||||||||||||||||||||||||||||||||||||||||||||||||||||||||||||||||||||||||||||||||||||||||||||||||||||||||||||||||||||||||||||||||||||||||||||||||||||||||||||||||||||||||||||||||||||||||||||||||||||||||||||||||||||||||||||||||||||||||||||||||||||||||||||||||||||||||||||||||||||||||||||||||||||||||||||||||||||||||||||||||||||||||||||||||||||||||||||||||||||||||||||||||||||||||||||||||||||||||||||||||