


Some foods must be canned using a pressure canner to kill bacteria that can cause foodborne illness.
Extension for Real Life Blog
")

Adding more fruits and vegetables to your daily diet is one way to reduce your risk of high blood pressure.
Extension for Real Life Blog
")
Pages

Select Your County Office
Watch


Extension Matters Magazine
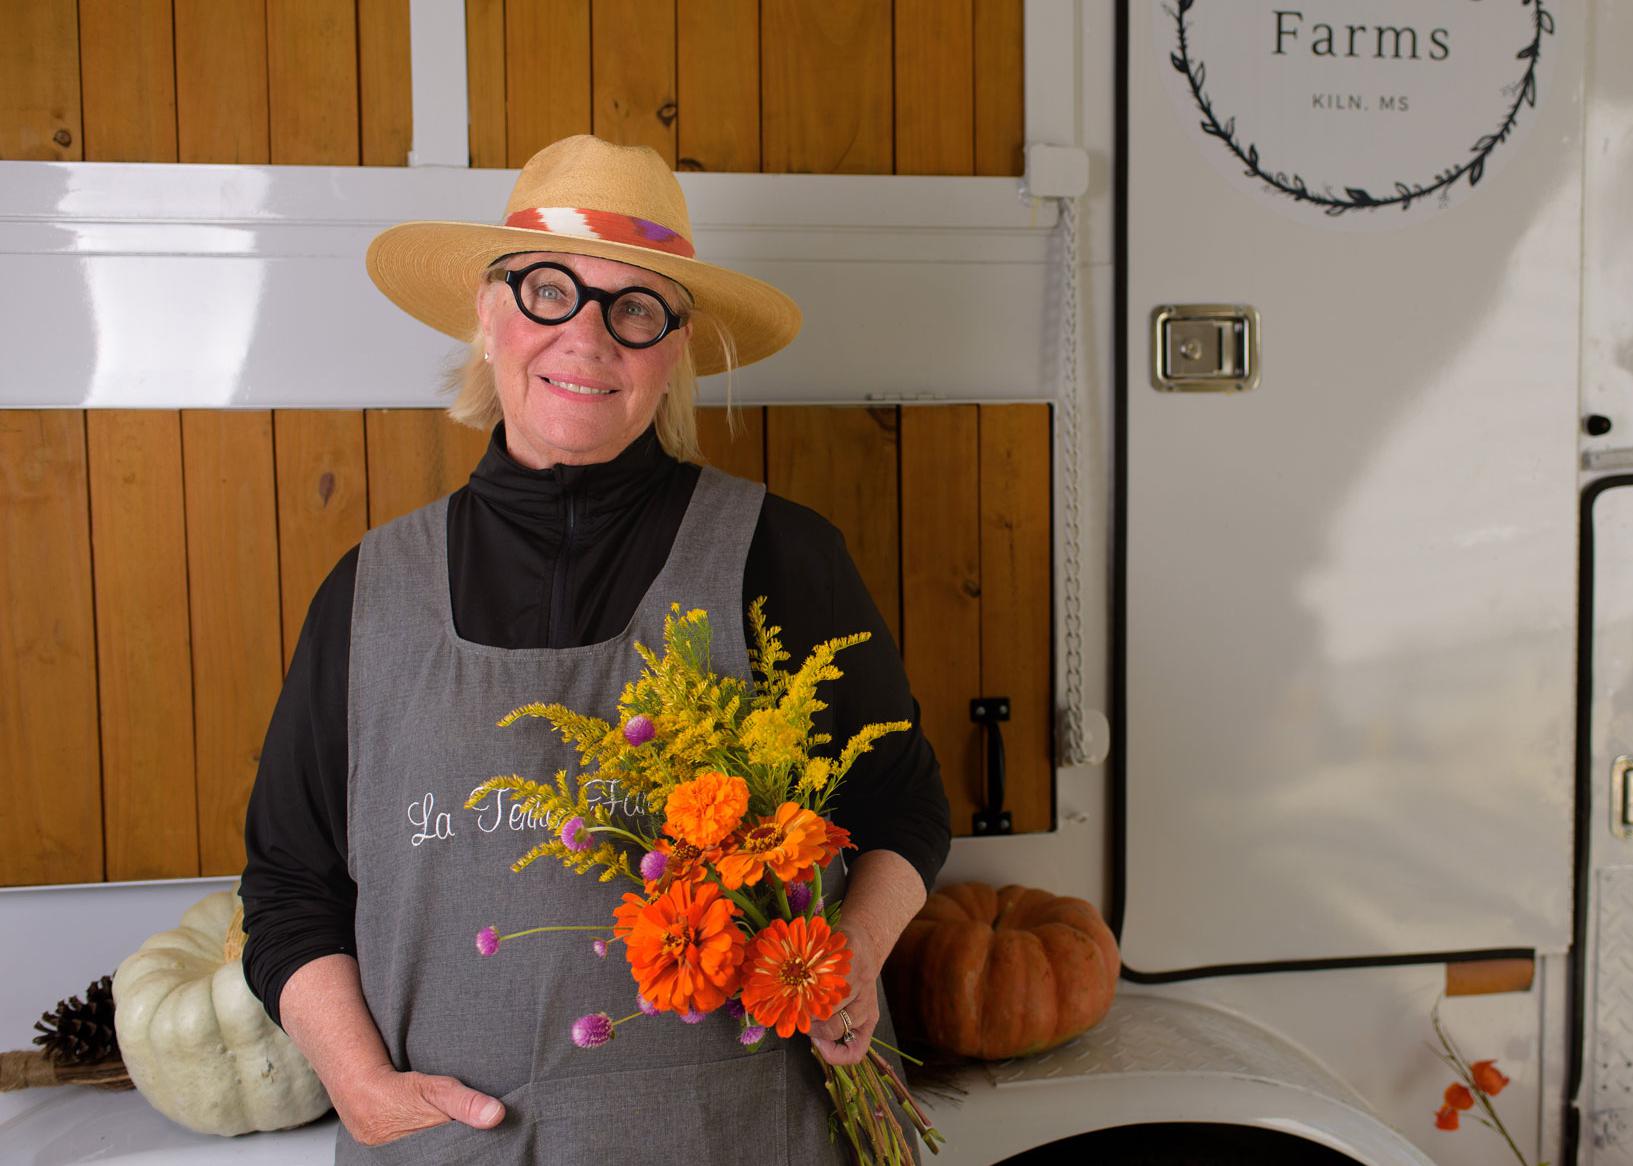
Teri Wyly, co-owner of La Terre Farms in Hancock County
Upcoming Events
Recent Publications
Publication Number: P2663
Publication Number: P2592
Publication Number: P3596
Publication Number: P3997
Publication Number: P3130